 Justin van Oel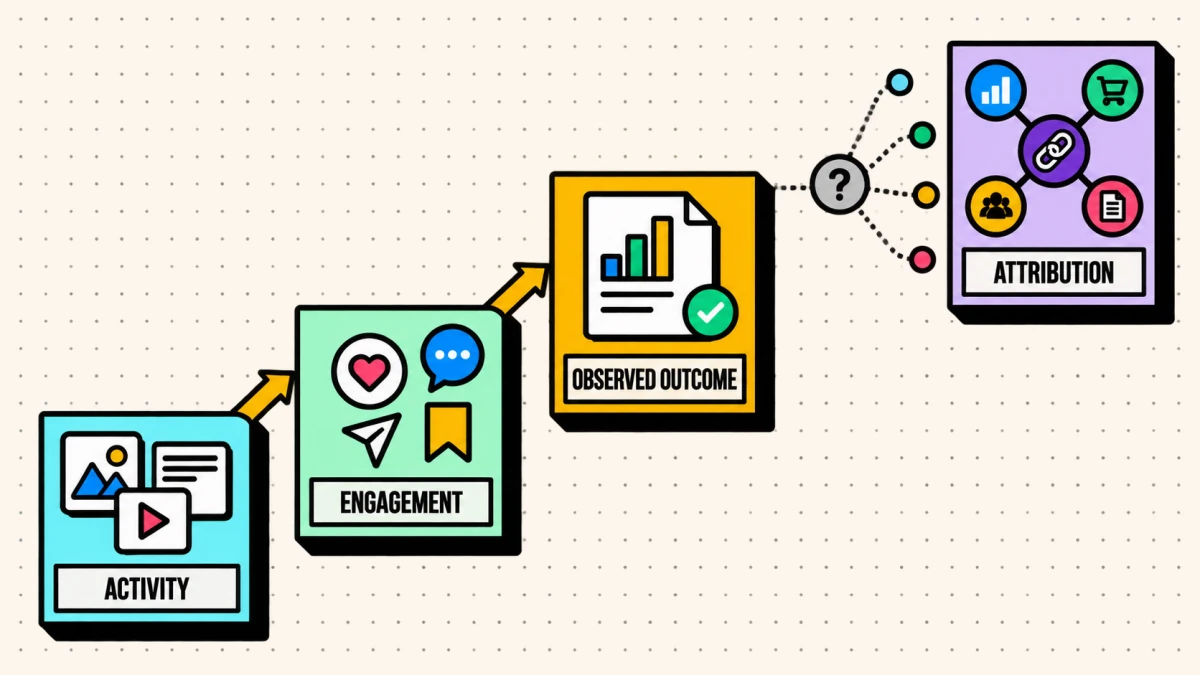
B2B social media measurement becomes difficult when teams confuse activity, observed outcomes, and attributed commercial impact. Likes and impressions describe platform activity. Pipeline and revenue require additional evidence, assumptions, and usually CRM or analytics data. The goal is not to force every effect into one number; it is to make the evidence and uncertainty visible.
The answer is not a magic dashboard. It is a clear definition, an honest view of what social can and cannot prove, and a hierarchy of metrics that connects activity to revenue. Measurement is the part of a B2B social media marketing program that tells you where to invest next.
What social media ROI means for B2B
Social media ROI is the return attributed to social activity relative to its cost, usually expressed as a percentage. In B2B, the evidence may combine tagged traffic, observed account engagement, self-reported discovery, CRM campaign membership, and modeled attribution. Each signal has limitations, so distinguish what was observed from what was inferred.
The social media ROI formula
The formula itself is simple. The work is in defining the inputs honestly.
ROI = (value generated − cost of the program) / cost of the program, expressed as a percentage.

Turn your brand context into social drafts
Turn your brand context into platform-aware social drafts for your connected channels. Start free, no credit card.
For B2B, each input needs a definition:
- Value generated must use one consistent unit. If you start with opportunity count, estimate expected revenue as opportunity count × expected win rate × average realized deal value. If you start with pipeline value, use pipeline value × expected win rate. For a true ROI calculation, use attributable gross profit or contribution value where available; otherwise label a revenue-based calculation as a proxy.
- Cost of the program is the fully loaded cost: tools, ad spend, agency fees, and the time your team spends, not just the software bill.
The honest caveat: B2B attribution is directional, so treat the output as a confidence range, not a precise figure. The formula is still worth running, because the act of defining the inputs forces the conversation about what social is actually supposed to return.
A worked example
The numbers below are illustrative, not benchmarks. Suppose a quarter of social activity costs $20,000 in fully loaded time, tools, and spend. Under the team’s stated attribution rule, social is a meaningful touch on opportunities representing $250,000 in pipeline. At a 20 percent expected win rate, the revenue proxy is $50,000.
Revenue-proxy ROI = ($50,000 − $20,000) / $20,000 = 1.5, or 150 percent. This is not a gross-profit ROI unless the value input is converted to attributable gross profit or contribution value.
The point of the calculation is not the 150 percent. It is that every input is now something you can argue about and improve: tighten the definition of "meaningful touch," raise the close rate, or lower the cost. A number you can interrogate beats a dashboard you can only admire.
Separate vanity, engagement, and outcome metrics
Not all metrics deserve the same attention. A simple tiering keeps reporting focused.
| Tier | Examples | What it tells you | Who cares |
|---|---|---|---|
| Vanity | Impressions, follower count | Potential reach signal | Context only |
| Engagement | Saves, shares, comments, profile visits | Observed interaction; audience quality needs separate evidence | The content team |
| Outcome | Site visits, demo requests, influenced pipeline | Commercial value attributed under the stated model | Leadership and finance |
Report mostly on engagement and outcome. Keep vanity metrics for context, not as headline numbers.
If a metric cannot change a decision, it does not belong in your report. It belongs in an archive.
Map metrics to the buyer journey
Each metric means more when it is tied to the stage of the journey it actually reflects:
| Stage | Metric | What it signals |
|---|---|---|
| Awareness | Reach, branded search volume | Potential awareness signal |
| Consideration | Profile visits, saves, shares | Observed interaction; audience quality requires separate evidence |
| Intent | Site visits from social, content downloads | Observed visit or download; intent requires interpretation |
| Decision | Demo requests, influenced pipeline | Commercial contribution attributed under the stated model |
A report organized this way tells a story (notice, engage, act, convert) instead of listing disconnected numbers.
Be honest about attribution
B2B buying journeys are long and multi-touch. Someone reads three posts, forgets you, sees a colleague share you, then searches your name two months later. No model captures that perfectly. It helps to know what each common model does and does not show:
| Model | What it credits | Honest verdict for B2B |
|---|---|---|
| First-touch | The first interaction | Good for awareness, blind to everything after |
| Last-touch | The final interaction | Overcredits the closing channel, usually search |
| Multi-touch | A share to every touch | Closer to reality, harder to set up |
| Self-reported | What the buyer says | Imperfect; can capture some discovery that click-based analytics misses |
Two practical habits help regardless of model:
- Ask on the form. A “How did you hear about us?” field is imperfect but can capture some self-reported discovery that click-based analytics misses.
- Watch the trend, not the single number. Influenced pipeline over a quarter tells a truer story than any single attributed conversion.
Connect activity to pipeline
The most useful B2B social report links what you published to what happened downstream:
- Which content pillars precede demo requests.
- Which posts precede profile visits and later conversions, without assuming the post caused them.
- Whether branded search and social activity move together, without treating correlation as causation.
This is far easier when your content calendar is structured around clear pillars, because you can compare like with like instead of a pile of one-off posts.
The tracking you need in place
The ROI formula is only as good as the data feeding it, and most of that data has to be captured before the campaign, not reconstructed after. Three things do most of the work:
- Consistent UTM parameters on links you control, so compatible analytics tools can classify tagged campaign traffic more consistently; this does not establish causal attribution.
- A “How did you hear about us?” field on relevant forms, to capture some self-reported discovery that click-based analytics may miss.
- A branded-search baseline, tracked on a defined cadence, so you can compare whether branded search and social activity move together without assuming causation.
None of these is perfect on its own. Together they turn "social probably helped" into a defensible, directional picture.
A four-week social ROI setup template
Use this as an illustrative four-week implementation sequence. Whether the first report is defensible depends on data availability, consent, CRM definitions, analytics configuration, and attribution limits:
- Week one: add UTM tags to your social links and a "how did you hear about us" field to your forms. Record a branded-search baseline.
- Week two: agree with sales on the definition of an "influenced" opportunity, and add a field in the CRM to flag it.
- Week three: pick the three outcome metrics you will actually report (for example influenced pipeline, demo requests from social, and branded search) and drop the rest.
- Week four: run the ROI formula with the numbers you have, label the gaps honestly, and present the trend rather than a single figure.
The first report will be imperfect. That is fine. A directional number you can defend and improve beats a precise one you cannot.
Build a report an executive will actually read
A social report can fail when it is organized around the person who made it rather than the decision its reader needs to make. A report a leader will act on fits on one page and answers three questions: what did social influence this quarter, what is the trend, and what are we doing more or less of as a result. Lead with the outcome tier, show the trend over time, and keep the engagement detail in an appendix for anyone who wants it. The goal is a decision, not a data dump.
Metrics to stop reporting
Reporting is as much about subtraction as addition. A few numbers earn a place in a headline report far less often than they appear in one:
- Follower count as a headline. It rarely changes a decision and is easy to inflate.
- Raw impressions. A reach number with no engagement or outcome behind it tells you almost nothing.
- Per-post likes in isolation. Useful as a trend, misleading as a single figure.
- Vanity benchmarks against competitors. Their follower count is not your pipeline.
Cutting these is not about hiding numbers. It is about making the report short enough that the metrics which do change decisions are the ones people actually read.
Common ROI measurement mistakes
Common measurement mistakes include:
- Reporting activity as if it were outcome. "We posted 40 times" is an input, not a result.
- Chasing perfect attribution. Spending months building a flawless multi-touch model for a channel whose value is inherently directional. Get to good-enough and consistent, then move on.
- Counting last-touch only. A last-touch model may understate earlier social touchpoints, but those touchpoints still require observable evidence rather than assumed credit.
- Changing the definition every quarter. If "influenced pipeline" means something different in each report, the trend is meaningless. Pick a definition and hold it.
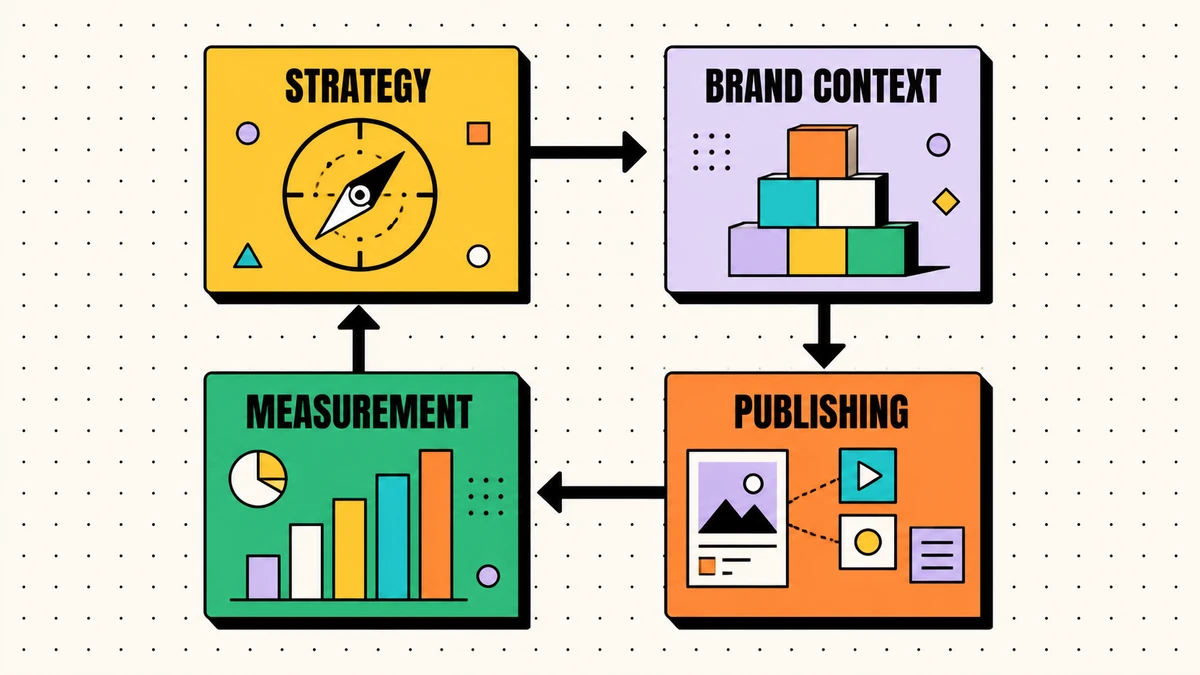
Measurement is not about proving social is perfect. It is about learning fast enough to put more effort where it already works, and less where it does not.
Measurement references
- Google Analytics, attribution overview: how attribution models assign credit across eligible touchpoints.
- Google Analytics, traffic-source scopes: the distinction between user, session, and event source dimensions.